Seed rounds in 2025 are back to basics: efficient growth, clear retention, and disciplined burn. If you’re raising in the GCC, investors will still fund ambition—but they now want proof you can compound revenue without leaking cash. This guide sets out realistic, evidence-backed ranges for core SaaS metrics at seed, how to calculate them, and what to fix first.
Key takeaways: Investors expect momentum and efficiency to coexist. Aim for ~10–20% MoM pre-seed growth or 40–80% YoY seed ARR growth with GRR ≥90% and NRR ≥100%. Push CAC payback ≤12–18 months; keep burn multiple ≤2.0 (sub‑1.5 is strong). Show clean cohort retention, credible pipeline coverage (3–4×), and short sales cycles for SMB/PLG motions. In GCC fundraising, bring local proof points—customers, references, and regionally relevant GTM—as H1‑2025 deal flow rebounded, but scrutiny on efficiency remains.
Use these ranges to frame your story, then show your trend lines.
What ‘good’ seed metrics look like in 2025
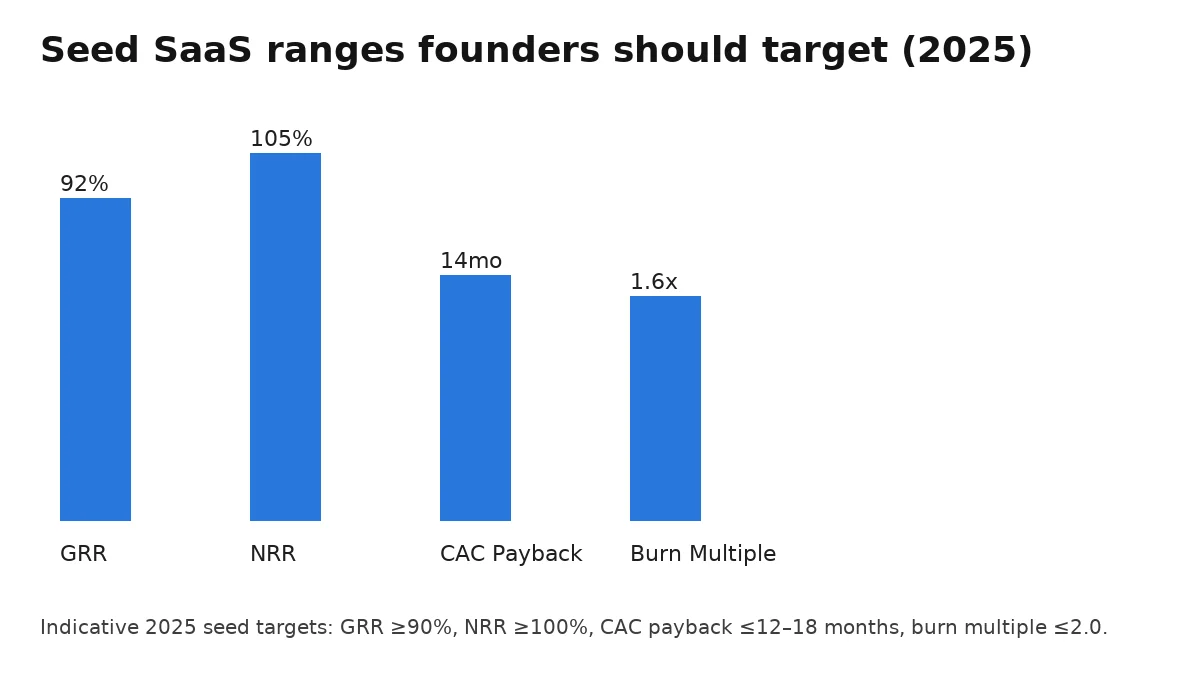
At seed, investors prioritise durable growth and efficiency. As a rule of thumb, target GRR ≥90%, NRR ≥100–110%, CAC payback ≤12–18 months, and burn multiple ≤2.0. For growth, 10–20% MoM pre‑seed or 40–80% YoY at seed is competitive in 2025.
The post‑2021 reset shifted attention from ‘grow at all costs’ to compounding efficiently. In practical terms, that means avoiding leaky buckets (churn) and proving that new bookings compound into retained revenue with expansion. While elite companies still post NRR >120%, most credible seed‑stage SaaS teams can justify 100–110% NRR with disciplined onboarding and expansion plays. On acquisition efficiency, CAC payback within 12–18 months is viewed as healthy at seed; sub‑12 months is excellent. For capital efficiency, a burn multiple ≤2.0 signals you add at least $0.50 of ARR per $1 burned; at ≤1.5 you’re in the top decile for early‑stage.
Why retention trumps raw growth
Retention is the compounding engine. GRR ≥90% shows you keep customers; NRR ≥100–110% shows you can expand them. Founders who publish cohort charts (logo + revenue retention) reduce diligence friction and justify higher valuations.
The efficiency trio: CAC Payback, Magic Number, Burn Multiple
Most seed checklists ask for CAC Payback and a sales efficiency signal (e.g., Magic Number around 0.75–1.5). Burn multiple ≤2.0 indicates disciplined scaling; sub‑1.5 suggests best‑in‑class efficiency for your stage.
Benchmarks founders actually hit (GCC context)
Across MENA/GCC in H1‑2025, funding picked up but remains selective. Seed investors are rewarding efficient GTM with credible retention. Expect scrutiny on GRR ≥90%, NRR ≥100%, CAC payback ≤18 months, and burn multiple ≤2.0, with local traction weighted heavily.
Regional data shows a rebound in 2025 headline volumes after a slow 2024, but cheque writers emphasise quality. In Saudi and the UAE—now the region’s funding anchors—teams that present local reference customers, verifiable ARR, and short payback tend to clear partner meetings faster. SMB/PLG motions with clear activation and expansion paths are in favour; enterprise plays must prove pipeline realism and procurement timelines. Founders should arrive with crisp monthly KPI time‑series and a short appendix explaining definitions.
What changed since 2024
Growth expectations normalised; efficient growth is non‑negotiable. Founders with CAC payback drifting past 18–24 months must show recent improvements (pricing, packaging, channel mix) or a credible plan to correct the slope.
Practical ranges we see at seed in 2025
ARR: $300k–$1.5m; YoY growth: 40–80%; GRR: 90–95%; NRR: 100–115%; CAC payback: 9–18 months; Burn multiple: 0.8–2.0. These are directional; investors will flex by market segment and ticket size.
How to calculate the big four (quick guide)
Use standard investor formulas: CAC Payback = CAC ÷ Gross Margin Adjusted ARPA contribution; Burn Multiple = Net Burn ÷ Net New ARR; NRR = (Starting ARR − Churn + Expansion) ÷ Starting ARR; GRR = (Starting ARR − Churn) ÷ Starting ARR.
Agree definitions before the meeting and show one consistent method. If in doubt, label the exact numerator/denominator and the period (e.g., last 3 months annualised). For CAC Payback, many investors accept a simple version: total S&M spend in period ÷ new gross margin‑adjusted ARR added in the same period. For Burn Multiple, divide net cash burn by net‑new ARR. For NRR and GRR, present cohort views so expansion/churn logic is transparent.
A simple sanity check
If your burn multiple is >2.5 and CAC payback >18 months while NRR <100%, you’re likely over‑investing in acquisition before product‑market fit is stable. Trim channels with low magic number, fix onboarding, and re‑price before scaling headcount.
What to plot on your metrics dashboard
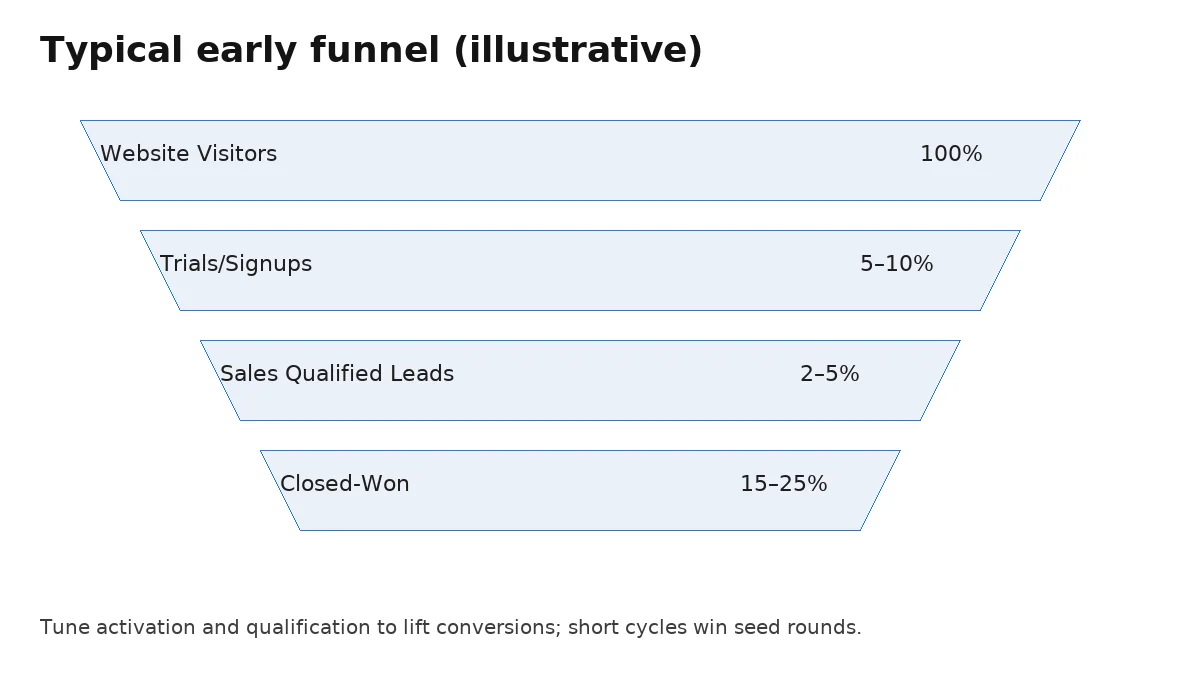
Plot MoM ARR growth, GRR/NRR, CAC payback (rolling), burn multiple (rolling), and pipeline coverage (3–4× next‑quarter target). Add win rate and median sales cycle by segment to pre‑empt diligence questions.
How to improve metrics fast (90‑day plan)
Start with retention, then fix payback. Ship onboarding fixes, expansion plays, and pricing clean‑ups; simultaneously prune expensive channels. Most teams can cut payback by 20–30% within a quarter without harming growth.
Week 1–2: baseline cohorts, map aha‑moment, instrument onboarding, and flag broken steps. Week 3–6: ship two fixes to reduce time‑to‑value, add one expansion lever (seat‑based pricing thresholds, usage bundles), and run a pricing ‘floor’ test to lift ARPA. Week 6–12: prune bottom‑quartile channels, reduce discounting, and tighten ICP. Add quarterly renewal playbooks with success plans by segment. Review pipeline hygiene weekly and enforce exit‑criteria to cut cycle times.
Core Web Vitals for your product site (INP, LCP, CLS)
Fundraising pages must feel instant. Target INP ≤200 ms, LCP ≤2.5 s, CLS ≤0.1. Use a lightweight hero image (≤150 KB WebP), preconnect critical origins, defer non‑critical scripts, and keep cumulative layout shifts under control by reserving media space.
Data room readiness
Include a one‑pager with KPI definitions, 24‑month monthly metrics CSV, cohort retention, and GA4 screenshots for your top‑of‑funnel. If you quote any benchmark, cite the source and date in an appendix.
What investors actually read in your deck and data room
They skim for coherence first, then drill into the numbers.
Expect partners to scan your 10–12 slide deck for narrative flow—problem, wedge, traction, unit economics—before opening the data room. Once inside, they will jump to the monthly metrics CSV, cohort retention, and sales pipeline exports. If your KPI definitions differ from market norms, say so up front and include a ‘definitions’ tab. Keep raw exports (HubSpot/Salesforce, billing) available read‑only so analysts can reconcile ARR bridges and churn math without ping‑pong.
Deck hygiene founders underestimate
Use one metric per slide and a consistent date axis; label run‑rate vs GAAP revenue; annotate outliers (e.g., one‑off annual prepay). For GTM slides, state ICP, median sales cycle, win rate, and top three channels. If you show a ‘lighthouse customer’, name the live users and the exact workflow you replace.
Data room structure that reduces diligence time
Create a top‑level index: 01_Financials (MRR/ARR bridges, burn, runway), 02_GTM (funnel, cohorts, pricing), 03_Product (roadmap, security), 04_Legal, 05_References. Include a 24‑month monthly KPI sheet; a ‘read me’ tab with definitions; and a short note on how to reproduce your CAC payback and burn multiple from exports. If you sell in the GCC, add two regional reference calls upfront—investors move faster when customers validate locally.
Common pitfalls (and how to fix them)
The usual blockers are leaky retention, optimistic payback math, and slow cycles.
Leaky retention: diagnose by segment and by use case; fix onboarding and adopt success plans before pushing top‑of‑funnel spend. Optimistic payback: many teams ignore gross margin and implementation costs—include both and present a rolling median. Slow cycles: tighten qualification and exit criteria, reduce bespoke pilots, and pre‑empt procurement by publishing your security pack.
Pricing and packaging quick wins
Set a pricing floor to reduce discount variance; bundle usage into simple steps so expansion is obvious; and align tiers to outcomes rather than features. Revisit annual prepays to improve cash runway without distorting NRR. Where possible, anchor prices against a clear ‘cost of doing nothing’ business case.
Operational KPIs that show coachability
Track weekly: win rate, median cycle, pipeline hygiene (% with next step), and activation/TTV. Share one change log slide in the deck that lists what you shipped in the last 90 days and the metric impact. It signals learning velocity and reduces perceived risk.
FAQ
Quick answers to the metrics questions seed investors ask most often.
- What’s a good burn multiple at seed?
≤2.0 is generally acceptable; ≤1.5 is strong. If you’re >2.5, prioritise retention and payback fixes before scaling. - Is CAC payback of 20–24 months a deal‑breaker?
Not always—but you’ll need a credible path to ≤18 months within two quarters (pricing, packaging, channel mix). - Do I need NRR above 120% to raise?
No. NRR 100–110% with clean cohorts is common at seed. Above 115% tends to signal strong product‑led expansion. - What if my GRR is 85%?
Show a plan: churn reasons, onboarding fixes, success motions, and pricing changes. Investors will look for an improving trend line. - How much ARR should I have?
Seed rounds close with anywhere from $300k to $1.5m ARR in this climate. Momentum and efficiency matter more than a single ARR threshold.
Need help tuning these metrics?