Editable Google Sheet + scoring rubric video.
A good SDR scorecard makes performance obvious without encouraging spammy behaviour. This guide shows exactly what to measure, how to weight inputs vs outcomes, and how to write rubrics that drive better conversations. You’ll get an editable structure, Google Sheet formulas, and a plan to calibrate in weekly 1:1s.
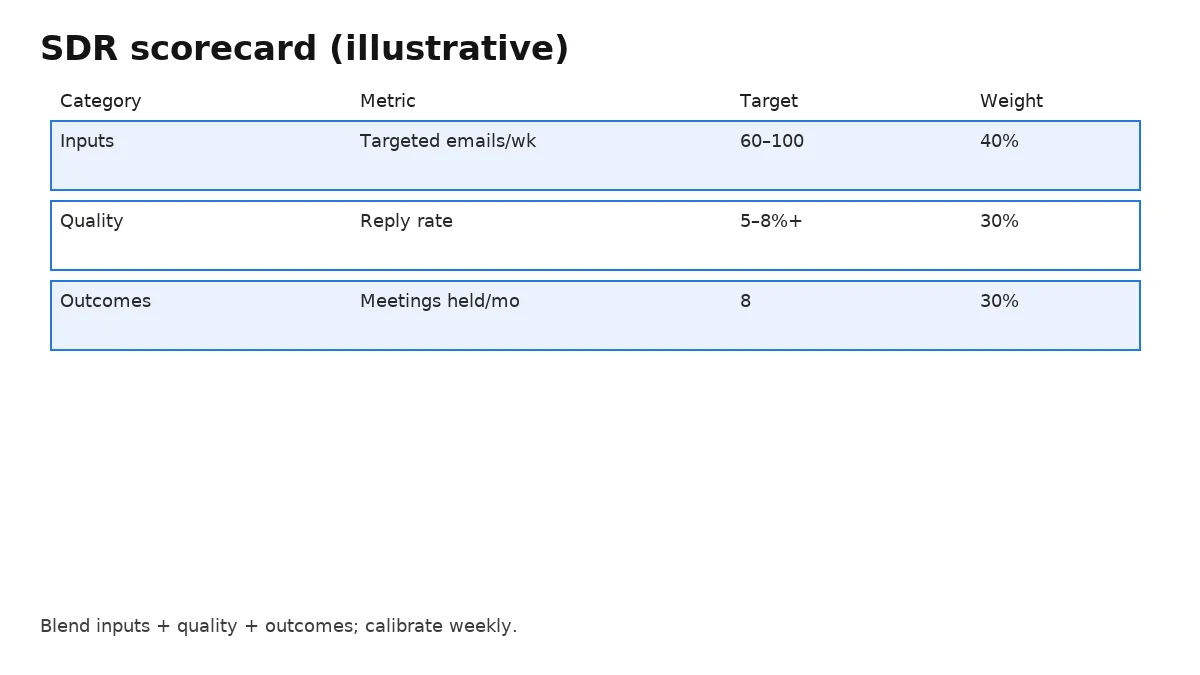
Key takeaways: Blend inputs (activity quality) and outcomes (meetings/pipeline). Weight what you control early in ramp, then tilt to outcomes. Use clear 1–5 rubrics, a single source of truth (CRM), and review weekly.
Blend inputs, quality, and outcomes; coach weekly.
Scorecard structure (copy/paste)
The short version
Score SDRs on inputs, quality, and outcomes with explicit rubrics. Start 50/30/20 (inputs/quality/outcomes) in ramp, shift to 30/30/40 by month three. Review weekly with coaching notes.
Inputs track consistent effort; quality checks if messages are specific and targeted; outcomes confirm market signal. Use a single sheet per SDR pulling from CRM exports; lock formulas and document definitions.
What to measure (and what to ignore)
Measure controllable inputs and conversion‑linked outputs; ignore vanity metrics like opens or raw dials without context.
Technology lead generation companies often use similar scoring systems because structured evaluation gives clearer insight into pipeline quality and helps teams identify the patterns that drive repeatable results.
Inputs: verified accounts added, targeted emails sent, calls with voicemail, LinkedIn touches, research notes. Quality: reply rate, positive reply %, ICP fit, message specificity. Outcomes: meetings held, qualified opps, pipeline created.
Weights that evolve with ramp
Use higher input weight in the first 60–90 days, then tilt to outcomes once patterns stabilise.
Example: Month 1 = 50/30/20; Month 2 = 40/30/30; Month 3+ = 30/30/40 (inputs/quality/outcomes). Document the schedule in the scorecard so expectations are clear.
Rubrics (1–5) you can copy
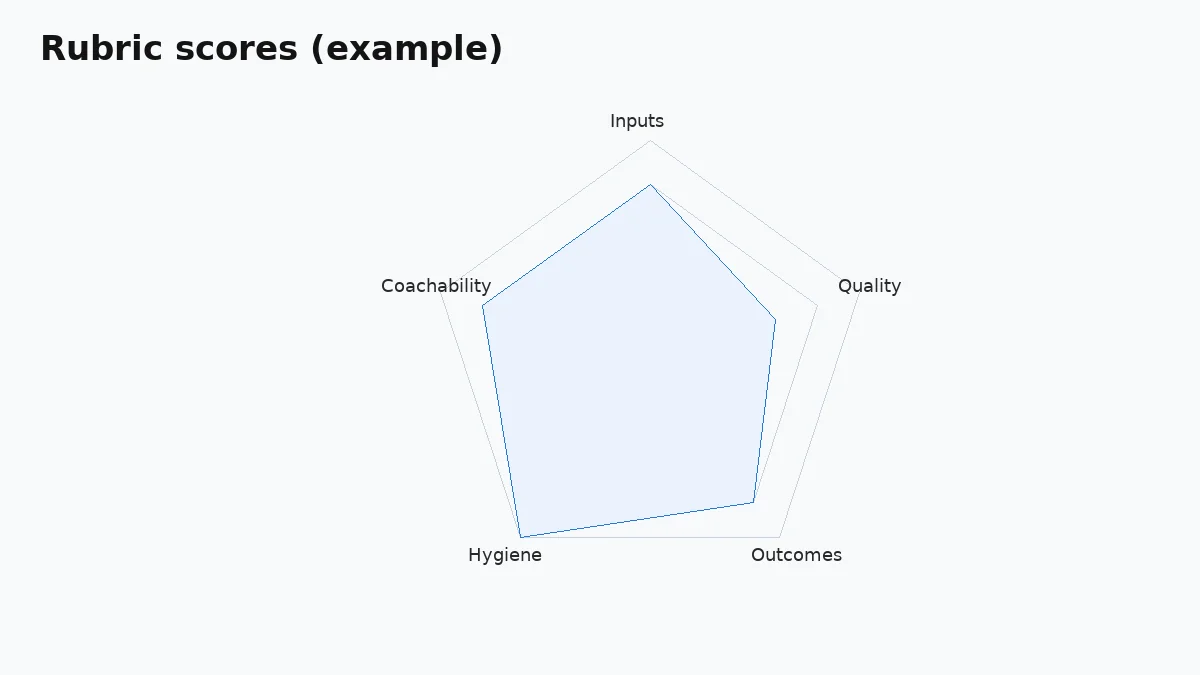
Write behaviour‑anchored descriptions so a ‘3’ vs ‘4’ is objective.
Inputs: 3 = meets weekly targets with some batching; 4 = consistent pacing with research notes; 5 = proactive list hygiene and segmentation. Quality: 3 = 3–5% replies; 4 = 5–8% replies with clear ICP; 5 = >8% replies and peer‑proof usage. Outcomes: 3 = hits meeting target; 4 = exceeds by 10–20%; 5 = creates pipeline beyond quota with clean hand‑offs.
Build it in a Google Sheet (copy/paste formulas)
One tab per SDR; one ‘Config’ tab for weights/targets; import CRM exports weekly and refresh pivots.
Use =SUMPRODUCT(values, weights) for the overall score. Lock cells with definitions; colour‑code by traffic‑light bands; add a ‘Coaching notes’ column per week.
Calibration in weekly 1:1s
Review highlights, blockers, and two specific experiments for the next week; update rubrics if a definition causes debate.
Bring two examples of messages (one good, one to improve). Agree on one experiment per channel and log it in the sheet. Re‑check pipeline attribution with AEs to keep trust high.
Dashboards & comp linkage
Show score, trend, and pipeline created per SDR; tie variable comp to outcomes and quality, not raw volume.
Avoid incentives that push quantity over relevance. Link a portion of variable to qualified opportunities and meeting quality (show rate, AE acceptance).
Core Web Vitals for the ‘book a demo’ page
If your scorecard drives better replies, don’t lose them on a slow page: INP ≤200 ms, LCP ≤2.5 s, CLS ≤0.1.
Optimise hero and proof images (≤150 KB WebP), reserve dimensions, and lazy‑load non‑critical JS. Provide a static PDF as a fast fallback.
Related reads: Outbound Sales Playbook, Multi‑touch Cadence, Cold‑email Deliverability 2025.
Ramp targets (first 90 days)
Make early wins achievable; increase complexity gradually.
Google Sheet formulas (paste‑ready)
Config‑driven so you can tune weights without breaking math.
# Config!B2:D2 = weights for Inputs,Quality,Outcomes (e.g., 0.3,0.3,0.4)
# Metrics tab has weekly data by SDR

OverallScore =
  SUMPRODUCT(
    {InputsScore, QualityScore, OutcomesScore},
    Config!B2:D2
  )

ReplyRate = Replies / Delivered

QualityScore =
  IF(ReplyRate<0.03, 2,
    IF(ReplyRate<0.05, 3,
      IF(ReplyRate<0.08, 4, 5)))

InputsScore =
  IF(TargetedEmails<60, 2,
    IF(TargetedEmails<80, 3,
      IF(TargetedEmails<100, 4, 5)))
Data dictionary (single source of truth)
Define each metric once and link it to a system and field.
Anti‑gaming pitfalls (and fixes)
Reward relevance, not volume.
- Issue: Thread‑jacking or fake forwards. Fix: disallow deceptive subjects; sampling check.
- Issue: Over‑broad lists to hit send targets. Fix: cap inputs and require ICP tags; audit 10 contacts/week.
- Issue: Low‑quality meetings. Fix: comp only on AE‑accepted meetings and pipeline.
Example rubric table (1–5)
Make the differences explicit.
Implementation plan (2 weeks)
Small team? This fits between calls.
- Day 1–2: agree definitions and targets; set weights in Config.
- Day 3–4: build SDR tabs; import past 4 weeks of CRM/engagement exports.
- Day 5: run a pilot score and 1:1; refine rubrics where ambiguous.
- Week 2: publish scorecard; start weekly calibration; add a dashboard view.
Checklist (pre‑publish)
Run before you roll it out.
- Definitions locked; examples added for edge cases
- Weights documented per ramp month
- Comp linkage updated (accepted meetings/pipeline)
- Sampling process for message quality
- Read‑only viewer links for SDRs/AEs; edit rights limited
Glossary (quick reference)
ICP: Ideal Customer Profile. AE accepted: meeting/opportunity approved by AE. Reply rate: unique replies / delivered. Rubric: behaviour‑anchored scoring scale.
Freshness & update cadence
Review quarterly with the team.
Update targets and weights if reply or meeting rates shift materially; log changes with dates so trends remain comparable.
AE acceptance & handoff (close the loop)
Score what the business values: accepted meetings and pipeline.
Define “accepted” clearly (ICP fit, pain, next step). Add a weekly 10‑minute AE review of the last five meetings: accept/decline + one note. Feed the note back into coaching and adjust the rubric examples so SDRs see what “good” looks like in context.
Coaching questions (use in 1:1s)
Turn the score into actions.
Which angle got the highest reply rate last week—and why? What would make this message more specific to the buyer? Which 10 accounts should we drop or swap? What tiny experiment will you run on Day‑1 emails before next week?
FAQ
Short answers on SDR scorecards.
- How often should we score?
Weekly during ramp, then bi‑weekly. Keep a monthly summary for comp and reviews. - Should we cap activity scores?
Yes—avoid ‘more is always better’. Cap inputs and shift weight to outcomes over time. - Where do numbers come from?
Your CRM plus engagement tools; export weekly and keep a suppression list to avoid duplicates. - How do we avoid gaming?
Define terms tightly, sample messages for quality, and tie comp to accepted meetings and pipeline, not just sends. - Can SDRs influence pipeline?
Yes—through fit and message quality. Scorecards should reward that, not just volume.
Want an SDR scorecard tailored to your ICP, motion, and ramp plan?