Your financial model should help you decide, not impress. This Seed–A template covers the must‑haves: a bottom‑up revenue build, a hiring‑driven cost plan, clear unit economics, and simple scenarios for runway. It’s pragmatic, fast to update, and easy to share with investors.
Key takeaways: Model monthly for 24–36 months. Build revenue bottom‑up from drivers, tie costs to the hiring plan, and keep a small KPI set (ARR, NRR, Gross Margin, Burn/Runway, CAC payback). Version with dates and lock a PDF for sharing.
Six tabs, bottom‑up revenue, hiring‑driven costs, and clear runway.
Recommended model tabs
The short version
Use 6 tabs: Assumptions, Revenue, Costs & Hiring, Unit Economics, Cash & Runway, KPI Dashboard. Keep inputs blue, formulas black, and outputs green.
Start from today’s baseline, add changes only where you have a story, and create three scenarios: Base, Upside, and Conservative. Investors care that assumptions are consistent and traceable—not that the sheet has 20 tabs.
Model structure (6 tabs)
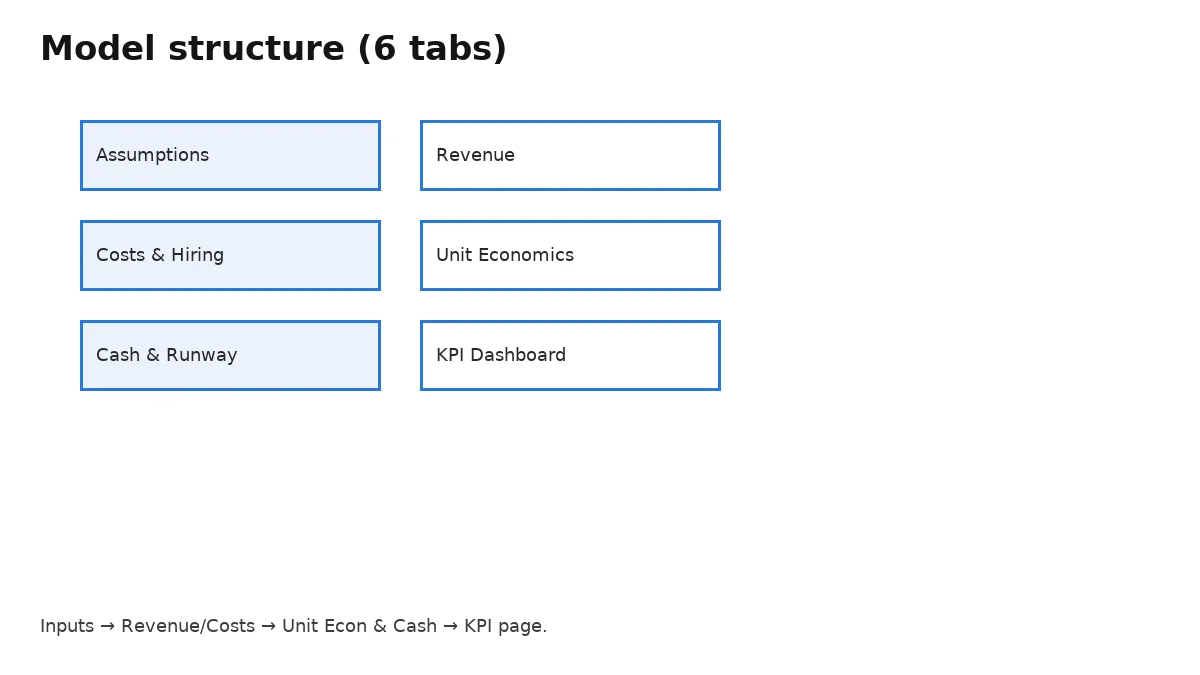
One assumptions page feeds Revenue and Costs; Unit Economics and Cash read from those; the KPI Dashboard charts the result.
Assumptions: prices, conversion, churn, sales productivity. Revenue: cohorts or funnel math. Costs & Hiring: headcount by function with salary, start date, benefits, and vendor costs. Unit Economics: LTV, CAC, payback, gross margin. Cash & Runway: bank, burn, months of runway.
Bottom‑up revenue build
Derive new business from funnel inputs (visits → trials → paid) or sales productivity (AEs × quota × attainment), then layer churn and expansion.
Prefer cohort math over averages. Keep price, discount, and ramp assumptions visible. For marketplaces/fintech, model GMV/TPV drivers and take rate.
Costs & hiring plan (the real driver)
Headcount drives most costs—model hires one by one with start dates and fully loaded costs. Vendor costs sit in a short GL list.
Avoid lump sums. Tie software and infra costs to usage where possible. Add a simple capex and depreciation row if relevant.
Unit economics (sanity checks)
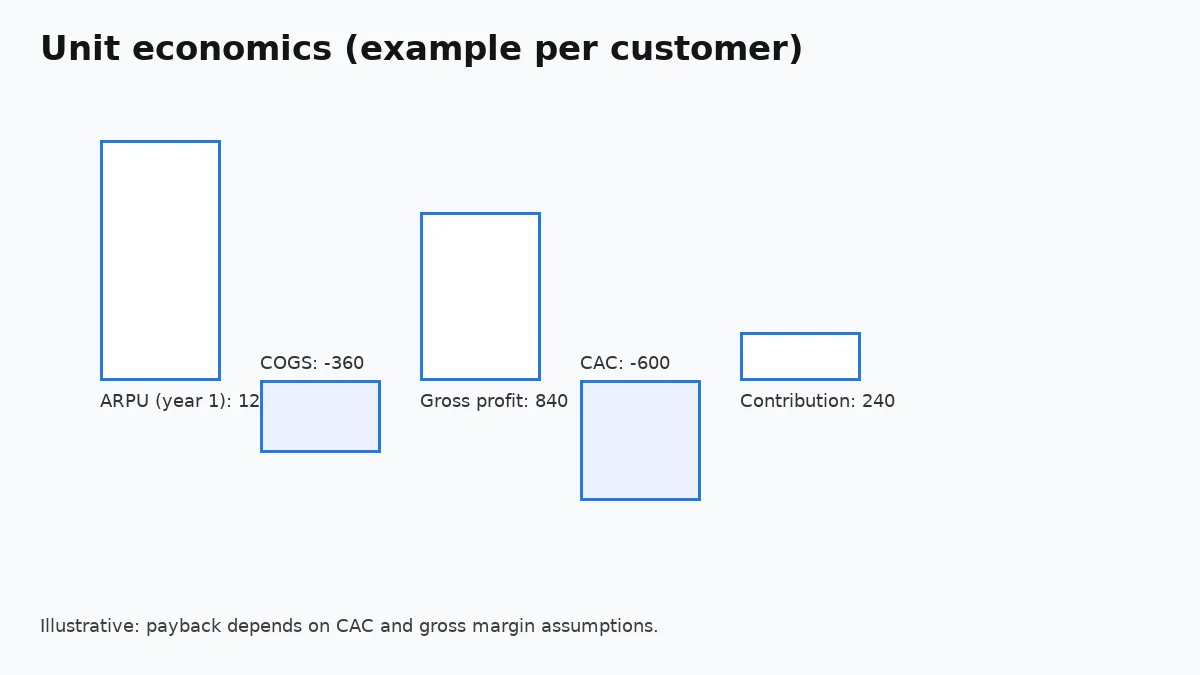
Show LTV/CAC, CAC payback, and gross margin. These should stabilise as the model scales; large swings mean an assumption is off.
For subscriptions, compute LTV from gross margin and churn; for transactional models, use contribution margin per order and repeat rate.
Runway & scenarios
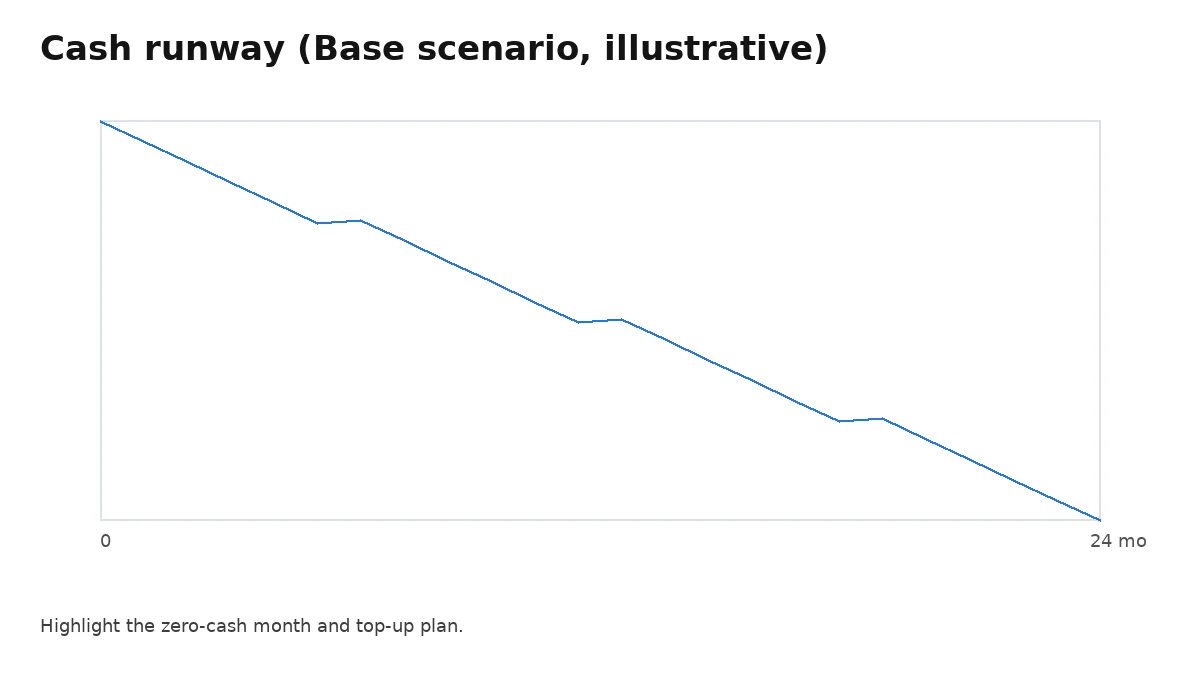
Chart bank balance by month; highlight the zero‑cash month. Keep Base, Upside (+10–20% top‑line, slower churn), and Conservative (−20% top‑line, slower hiring).
Use data validation to switch scenarios. If Base runway < 18 months, decide: reduce burn, raise earlier, or change the plan.
KPI dashboard (for investors)
A single page: ARR, Net New ARR, Gross Margin, Burn & Runway, CAC Payback, NRR/Logo Retention. Same charts every month.
Link each chart to its source range. Add notes for one‑offs and policy changes (e.g., price rise).
Model hygiene & sharing
Protect formulas, name ranges, and keep a change log. Save a PDF with the KPI page and key tables for circulation.
Use ISO naming (YYYY‑MM) and avoid ‘final_v7’. Store in your corporate folder with permissions. Keep a read‑only copy for diligence.
Core Web Vitals for investor pages
If you host live KPI charts, keep INP ≤200 ms, LCP ≤2.5 s, CLS ≤0.1. Prefer static images and reserved dimensions.
Compress WebP, preconnect to your CDN, and delay non‑critical scripts. Avoid layout shifts by setting width/height on images.
Related reads: Diligence Prep Checklist, Board Meeting Playbook, Monthly Investor Update Template.
Assumption ranges (guardrails)
Anchor inputs with sensible ranges so scenarios stay realistic.
- Top‑of‑funnel → trial: 2–8% (product‑led) or SDR connect rate 5–15%
- Trial → paid: 10–30% for PLG; AE win rate 15–30% (varies by segment)
- Gross margin: 70–85% typical SaaS (infra + support inside COGS)
- Churn: early logos 2–6% monthly; stabilising toward 1–3% as ICP fit improves
- Ramp: AEs hit full quota in 3–5 months; engineers start delivering value in month 2–3
Sensitivity analysis (what to test)
Move one assumption at a time, then combine the top two.
- Price ±10–20%
- Win rate ±5pp
- Churn ±1–2pp
- Hiring slip +1–2 months
- Payment terms (annual prepay vs monthly)
Revenue cohort example (walkthrough)
Simple cohort ladder keeps retention honest.
- Start with new customers each month from funnel or sales plan
- Apply first‑month revenue (price × discount)
- Apply monthly logo churn and expansion rate to get month‑n revenue
- Sum across cohorts → MRR; annualise for ARR
Investor export (what to include)
Send the story, not the raw workbook.
- One‑pager: ARR, NNR, Burn/Runway, Payback; brief commentary
- Selected tables: cohort MRR, headcount plan, cash bridge
- Assumptions page PDF with highlighted changes since last share
Common pitfalls (and fixes)
Keep the model a decision tool.
- Average churn → use cohorts
- Headcount blobs → model hires by start date
- Hidden drivers → centralise inputs on Assumptions
- Untraceable charts → link every chart to its range
Glossary (quick reference)
ARR: annualised recurring revenue. NNR: Net New Revenue/ARR. LTV: lifetime value (gross margin adjusted). CAC: customer acquisition cost. Payback: months to recover CAC on gross margin basis.
Freshness & update cadence
Update monthly; audit quarterly.
Paste actuals, annotate changes, and reset Base/Conservative/Up to reflect reality. Revisit the KPI set twice a year and drop vanity metrics.
Pricing & packaging (founder sanity)
Model price tests explicitly so the team can learn.
- Keep a price table by plan/segment with effective discounts
- Add a simple elasticity toggle (±10–20%) and watch payback/runway
- Separate packaging (what’s in each plan) from pure price to avoid tangled assumptions
Cash bridge (sources & uses)
Explain how cash moves, not just the end balance.
Hiring plan sheet (columns to include)
Granularity here prevents budget surprises.
Version control & audit trail
Future you will thank present you.
Name with ISO dates (2025-08 SeedA-Model-v1.3.xlsx), keep a “Changes” tab (date, author, summary), and export a PDF of KPI & key tables each month into your corporate folder. For diligence, include the assumptions page and cohort tables.
Data sources & traceability
Attach each KPI to a source and owner.
Next to every chart add a small note: formula, BI query/report, and the person accountable for quality. For example, “ARR = Σ active subs × annual price; Source: BI query 42; Owner: Finance; Cadence: monthly; Last refreshed: 2025‑08‑01.” This kills definitional debates and turns your model into a reliable operating system.
FAQ
Quick answers on Seed–A models.
- How many months should I model?
24–36 months monthly is enough for Seed–A. Don’t over‑fit beyond your line of sight. - Do I need GAAP/IFRS statements?
Keep a simple P&L and cash flow; full GAAP/IFRS becomes essential as you scale or approach audits. - What’s a good CAC payback?
Often ≤12–18 months for early SaaS; benchmark by segment. Focus on direction and evidence. - How often should I update?
Monthly. Lock the prior month, paste actuals, and roll forward assumptions. - Should I model every expense line?
No. Model headcount precisely; group the tail into a short vendor list.
Want a clean Seed–A model investors can trust?